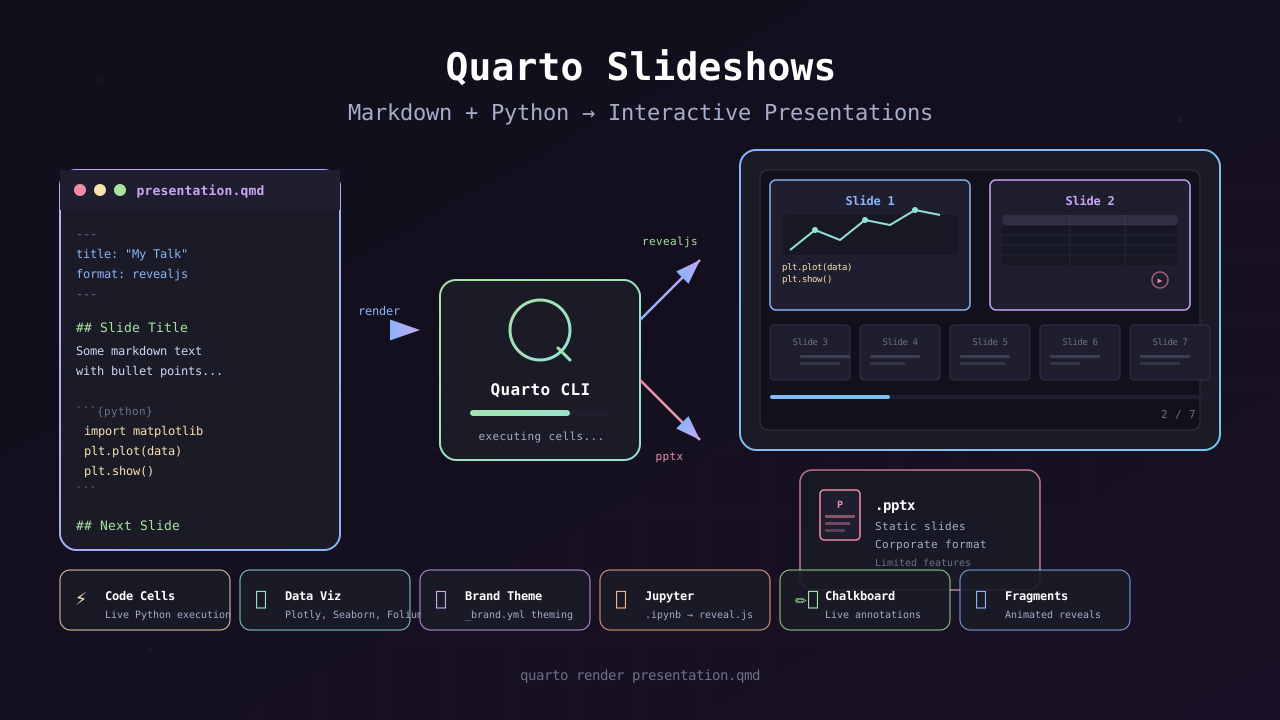
TL;DR: Quarto lets you write presentations as Markdown files with embedded Python code cells, then render them to interactive reveal.js slideshows or PowerPoint files. The workflow supports live plots, styled tables, animated fragments, brand theming, and Jupyter notebook conversion — all from a single
.qmdsource file.
Most data science presentations follow a fragile workflow: run code in a notebook, copy plots into PowerPoint, add text boxes, and hope nothing breaks when the analysis changes. Quarto replaces that pipeline with a single source file — a Markdown document (.qmd) that contains both narrative text and executable Python code cells. Rendering produces either an interactive HTML slideshow powered by reveal.js or a .pptx file for corporate environments.
The tool comes from Posit PBC (formerly RStudio) and is part of the broader Quarto ecosystem that also covers reports, dashboards, and books. The video tutorial by Keith Galli demonstrates the full feature set, from basic slide structure through brand theming and Jupyter notebook integration.
Quarto Slideshow Basics
A Quarto presentation starts as a .qmd file — Quarto Markdown. The file uses YAML front matter between --- delimiters to declare the output format, then uses standard Markdown for content.
---title: "My Cool Quarto Slideshow"author: "Keith"format: revealjs---The format: revealjs setting tells Quarto to render the file as an interactive HTML slideshow. Two output formats are available: revealjs (recommended for interactive presentations) and pptx (PowerPoint export).
Slide breaks are created with level-2 headers (##). Level-1 headers (#) define major sections. This means the slide structure is entirely controlled by Markdown heading levels — no special syntax required.
Code Cells
Python code is embedded using fenced code blocks with a {python} language tag:
```{python}import matplotlib.pyplot as pltplt.plot([1, 2, 3, 4])```When rendered, the code executes and the output (plots, tables, text) appears directly on the slide. The basic distinction is:
```{python}(no dot) — runs the code and displays output```{.python}(with dot) — displays code only, without execution
The dot syntax is useful when demonstrating code examples without showing the output, similar to how documentation sites display code snippets.
Rendering
Quarto provides a CLI and a VS Code extension. The render command is straightforward:
quarto render slideshow.qmdThe VS Code extension adds a preview button for live rendering during editing, which speeds up iteration significantly.
Output Format Comparison
The two output formats serve different use cases. Reveal.js produces feature-rich HTML presentations, while PowerPoint output covers enterprise requirements.
| Feature | revealjs | pptx |
|---|---|---|
| Interactive elements | Zoom, hover, pan on plots | Static images only |
| Animations | Fragments, transitions, incremental lists | Basic slide transitions |
| Code execution | Live output rendering | Static snapshots |
| Self-contained export | embed-resources: true | Native .pptx format |
| Custom theming | CSS, _brand.yml, backgrounds | PowerPoint templates |
| Chalkboard annotations | Built-in (chalkboard: true) | Not available |
| PDF export | Via browser print | Native |
| Corporate compatibility | Requires browser | Universal |
Tip: Use revealjs for development and internal presentations. Switch to
format: pptxonly when the audience requires PowerPoint files — the feature set is narrower, but it covers the basic need for slide-based delivery.
RevealJS Output Configuration
The reveal.js format supports granular configuration through the YAML front matter. These options control slide numbering, footers, resource embedding, and transitions.
---format: revealjs: slide-number: true footer: "[Quarto Docs](https://quarto.org)" embed-resources: true transition: concave---Slide Numbers and Footers
The slide-number: true option displays slide numbers at the bottom-right of each slide. The footer option adds persistent footer text to every slide and supports Markdown syntax — links, formatting, and inline code all render correctly.
A per-slide footer override is also available by setting footer: in slide-level attributes, which is useful when a specific slide needs different attribution.
Self-Contained Files
Setting embed-resources: true bundles all CSS, JavaScript, images, and fonts into a single HTML file. This eliminates external dependencies and makes the presentation portable — it can be shared as one file and opened in any browser without an internet connection.
Note:
embed-resources: trueis incompatible withchalkboard: true. The chalkboard feature requires external scripts that cannot be embedded.
Line Highlighting
Code blocks support progressive line highlighting, which reveals lines step-by-step as the presenter advances the slide:
```{python highlight-lines=[4-5, 7, 10]}import pandas as pdimport numpy as npimport matplotlib.pyplot as plt
df = pd.read_csv("data.csv")df["total"] = df["a"] + df["b"]
plt.figure()plt.plot(df["x"], df["total"])plt.show()```The highlight-lines attribute accepts ranges (4-5) and individual lines (7), separated by commas. Each slide advance highlights the next group. Adding highlight-lines=[1-10] at the end of the list shows all lines unhighlighted for reference.
Code Cells and Execution Control
Quarto provides several options for controlling how code cells appear and where their output is placed. These options are set as attributes on the code fence.
Echo and Output Location
The echo option controls whether the code itself is visible:
echo: true— displays both the code and the output on the same slideecho: false(default) — hides the code, shows only the output
The output-location option controls where the output appears relative to the code:
```{python output-location: slide}# Output appears on the NEXT slide at full size```
```{python output-location: column}# Code on left, output on right — side by side```
```{python output-location: column-fragment}# Output on right side, revealed after clicking```
```{python output-location: false}# Hide output entirely — show only code```The column-fragment option is particularly useful for teaching — the code is visible, and the output appears only when the presenter clicks, creating a natural pause for the audience to read the code first.
Figure Captions
Add captions below figures with the fig-cap option:
```{python fig-cap: "Revenue by Quarter"}plt.bar(quarters, revenue)plt.show()```Preventing Content Overflow
When plots or code blocks are large, they can overflow the slide boundaries. Wrapping code blocks in a <div> with a CSS class prevents this:
<div class="smaller">```{python}# Large plot code hereWithout this wrapper, the content may not fit the slide and will be clipped or cause scrolling issues.
Data Visualization
Quarto supports the full Python visualization ecosystem. Plots render directly on slides as the code cells execute, and interactive libraries produce live, manipulatable visualizations.
Supported Libraries
- matplotlib — Standard static plots. Renders as PNG/SVG images on slides.
- plotly — Interactive plots with zoom, hover tooltips, and pan support. The full interactivity is preserved in the HTML output.
- seaborn — Statistical visualizations built on matplotlib. Works identically to matplotlib in Quarto.
- folium — Interactive maps based on Leaflet.js. Renders as embedded, navigable maps on slides.
Interactive Plotly Example
Plotly charts are fully interactive in reveal.js output. The audience can zoom into specific regions, hover over data points to see values, and pan across the chart:
```{python output-location: slide}import plotly.express as pxdf = px.data.gapminder().query("year == 2007")fig = px.scatter(df, x="gdpPercap", y="lifeExp", size="pop", color="continent")fig.show()```Using output-location: slide here gives the plot a full-size slide, which is ideal for interactive charts that need space for zooming and hovering.
Tip: Use
output-location: slidefor large plots and interactive visualizations. Useoutput-location: columnwhen the code is short and you want the audience to see both simultaneously.
Tables and DataFrames
Displaying tabular data on slides is handled through standard DataFrame output or the great_tables library for styled presentations.
Basic DataFrame Display
Simply referencing a DataFrame at the end of a code cell displays it on the slide:
```{python}import pandas as pddf = pd.read_csv("sales.csv")df # Display the DataFrame```This produces a basic HTML table. For large DataFrames, the output can overflow the slide.
Great Tables Library
The great_tables Python library generates styled, publication-ready tables. It is the recommended approach for professional presentations:
```{python}from great_tables import GTGT(df)```Great Tables produces tables with proper formatting, alignment, and styling that look significantly better than default pandas output.
Table Layout Options
Large tables need layout controls to fit on slides. These options are set as code cell attributes:
```{python scrollable: true width: 1800 margin: 0 scale: 2}from great_tables import GTGT(df)```| Option | Effect |
|---|---|
scrollable: true | Enables scrolling when table overflows the slide |
width: 1800 | Sets the table width in pixels |
height | Sets the table height |
margin: 0 | Removes margins for edge-to-edge display |
scale: 2 | Dynamic scaling factor (default: 2, adjusts on window resize) |
The scrollable: true option is critical for wide tables — without it, the table can break the slide layout.
LaTeX Equations
Mathematical equations render directly in slides using standard LaTeX syntax:
::: {layout-ncol=2}::: {.column-width="40%"}$$ \int_{0}^{\infty} e^{-x^2} dx = \frac{\sqrt{\pi}}{2} $$:::::: {.column-width="60%"}$$ = \text{rendered result} $$::::::Column layouts let you show the LaTeX source on one side and the rendered equation on the other, which is useful for teaching mathematical concepts.
Presentation Features
Reveal.js provides a rich set of presentation features that Quarto exposes through Markdown syntax and YAML configuration.
Incremental Lists
List items can appear one at a time with the ::: incremental directive:
::: incremental- First point appears immediately- Second point appears on click- Third point appears on click:::This keeps the audience focused on one point at a time rather than reading ahead through the entire list.
Fragments
Individual elements can be animated with fragment directives. Multiple animation types are available:
::: {.fragment type="fade-in"}Content that fades in from transparent:::
::: {.fragment type="fade-up"}Content that slides up into view:::
::: {.fragment type="fade-left"}Content that slides in from the right:::
::: {.fragment type="semi-out"}Content that fades to semi-transparent:::Fragment Indexing and Absolute Positioning
Fragments support an index attribute that controls appearance order. Lower index values appear first, and elements without an index appear after all indexed elements:
{.fragment index=3 style="position:absolute; left:10%; width:200px; top:30%"}Combining absolute positioning with fragment indexing enables precise control over when and where elements appear — useful for building dramatic reveal sequences.
Slide Backgrounds
Slides support multiple background types, set through slide-level attributes:
background-color: "#0000FF"background-image: "milky-way.jpg"background-video: "video.mp4"background-iframe: "https://example.com"Background images, videos, and even iframes add visual depth to slides. The iframe option is useful for embedding live web content or dashboards.
Slide Transitions
Transition effects between slides are configured globally:
format: revealjs: transition: concaveAvailable transitions include concave, zoom, fade, convex, and others. The default is none (no transition).
Tab Sets
Tabbed interfaces can be created within slides to organize content:
::: {.panel-tabset}### Plot TabPlot content here
### Data TabData table here:::This is useful when a slide needs to show multiple views of the same data — for example, a plot tab and a raw data tab side by side.
Keyboard Shortcuts
Reveal.js provides keyboard shortcuts for navigation, annotation, and export during presentations.
| Shortcut | Action |
|---|---|
Alt + click | Zoom into a specific area of the slide |
B or . | Blackout screen (pause presentation) |
R | Toggle scroll view |
E | Enter overview mode / PDF export mode |
G then type number | Jump to a specific slide number |
M | Toggle tools menu |
C | Activate chalkboard (when enabled) |
Esc | Overview mode (see all slides as thumbnails) |
Chalkboard
The chalkboard feature lets the presenter draw and annotate directly on slides during the presentation:
format: revealjs: chalkboard: truePress C to activate drawing mode. This is particularly useful for lectures and live explanations where handwritten annotations add value. The chalkboard is not available when embed-resources: true is set, since the drawing scripts cannot be embedded.
PDF Export
To export the presentation as a PDF:
- Press
Eto enter overview mode - Right-click and select Print
- Choose “Save as PDF” in the print dialog
This produces a PDF version of the entire presentation, useful for distributing to audiences who cannot view HTML files.
Tip: Use
Alt + clickto zoom into specific areas of a slide during a live presentation. This is effective for emphasizing details in complex plots or tables without creating separate slides.
Brand Theming with _brand.yml
Quarto’s brand system provides consistent theming across all output formats — reveal.js slideshows, dashboards, and HTML reports share the same brand file.
Brand File Structure
A brand.yml file defines colors, logos, typography, and metadata:
colors: primary: "#0066CC" secondary: "#00AA44" background: "#FFFFFF" foreground: "#333333"
logo: "logos/company-logo.png"
typography: font-family: "Inter, sans-serif" heading-font-family: "Inter, sans-serif"
meta: author: "Company Name"Automatic Detection
Naming the file _brand.yml (with the underscore prefix) triggers automatic detection. Quarto applies the brand to all .qmd files in the project directory without any explicit reference in the YAML front matter.
For explicit per-file control, reference the brand file directly:
format: revealjs: brand: brand.ymlWhat Brand Files Control
- Color palette — Primary, secondary, and accent colors across all slides
- Logo — Displayed on slides (position controlled by theme)
- Typography — Font families for body text and headings
- Consistency — All team members using the same
_brand.ymlproduce visually consistent presentations
Note: The Quarto documentation includes LLM prompts for generating brand files. This makes it easy to produce a brand file from a verbal description of the desired style.
Jupyter Notebook Integration
Existing Jupyter notebooks (.ipynb files) can be converted to reveal.js presentations with minimal changes. The workflow adds YAML front matter to the notebook and renders through the Quarto CLI.
Adding Slide Format to Notebooks
Insert a YAML front matter cell at the top of the notebook:
---format: revealjs---Then render from the terminal:
quarto render example.ipynb --executeThe --execute flag is important — it ensures all notebook cells run during rendering. Without it, cells may not execute and outputs will not appear in the slideshow.
Notebook Structure
A typical notebook-to-presentation flow:
- Markdown cell: Title and introduction
- Code cell: Library imports (e.g.,
import pandas as pd) - Markdown cell: Section header (
## Analysis) - Code cell: Data loading and processing
- Markdown cell: Section header (
## Visualization) - Code cell: Plot with
echo: true
All Quarto cell options work in notebooks — echo, output-location, highlight-lines, fig-cap, and table options are all supported.
Keeping YAML Separate
The YAML front matter should be in its own cell, separate from any code. Mixing YAML and code in the same cell can cause parsing issues.
Tip: This workflow is ideal for data science teams that already maintain analysis notebooks. Converting to a presentation requires only adding the format declaration — the analysis code, plots, and narrative remain unchanged.
Practical Workflow Summary
The typical Quarto slideshow workflow:
- Create a
.qmdfile with YAML front matter declaringformat: revealjs - Write content using Markdown headings (
##for slides,#for sections) - Embed Python code cells for plots, tables, and computations
- Use
output-locationoptions to control layout (slide, column, column-fragment) - Add fragments and incremental lists for animated reveals
- Apply
_brand.ymlfor consistent theming - Render with
quarto renderand preview in VS Code
For teams requiring PowerPoint output, switch format: pptx and rerender. For existing notebooks, add the YAML front matter cell and render with --execute.
References
- Create slideshows with Markdown & Python Code! (Quarto Tutorial) — Keith Galli, Posit PBC, YouTube (January 10, 2025) — https://www.youtube.com/watch?v=kWnMc0GwX-U
- Quarto reveal.js Documentation — Posit PBC — https://quarto.org/docs/presentations/revealjs/
- quarto-projects — Keith Galli, GitHub (accessed May 31, 2026) — https://github.com/KeithGalli/quarto-projects
- Great Tables for Python — Posit Software, GitHub — https://github.com/posit-dev/great_tables
- Quarto Brand Theming — Posit PBC — https://quarto.org/docs/output-format-reference/brand.html
This article was written by Pi (worker agent | pi-coding-agent), based on content from: https://www.youtube.com/watch?v=kWnMc0GwX-U